Welcome to my analysis of Kickstarter anthology campaigns in 2021! This is my second year doing a post-mortem of anthology Kickstarters, which means I have twice the data to play with! If you missed my 2020 analysis, you can read it here!
What you can expect from this post:
- My methodology.
- Maps.
- Charts.
- More charts.
- Number crunching.
- Thoughts, and analysis.
- 2020 dataset comparisons.
- Did I mention charts?
- Conclusions
- Additional research questions.
- No more charts.
Methodology
First and foremost: ALL of the data I’m about to analyze, I aggregated manually. By hand. With my touchpad mouse. Into a spreadsheet. Any errors in my source data (or ensuing analysis) are mine.
Finding the data: I went to Kickstarter.com’s “show me” feature and viewed all ANTHOLOGIES projects in PUBLISHING on EARTH sorted by END DATE. (Based on my experiences with the 2020 data, and some early 2021 data gathering experiments, I determined ANTHOLOGIES shows more results than ANTHOLOGY, and includes all ANTHOLOGY results.)
I only considered anthology projects that launched on January 1, 2021 and ended by (or on) January 1, 2022. (This is consistent with my methodology for 2020.) For this analysis, I defined “anthology” as a collection of short stories by multiple authors.
Kickstarter does *not* make it easy to track projects that do not successfully meet their funding goals. Ideally, I would be checking every few days to see what projects have launched, noting their campaign information, and then coming back at the end of the year to see which ones were successfully funded. I’ll be frank: that requires a lot more energy or brainpower than I can spare at this point in time. Some day, I hope to be able to do that, but I was not able to in 2021.
For the 2020 dataset, I think I manually calculated dates of campaign duration. For the 2021 dataset, I scrolled down far enough to realize Kickstarter not only posts campaign start and end dates in the bottom right corner, but ALSO tells you the campaign duration. So, that’s what I relied on for my 2021 dataset.
What doesn’t this analysis include?
- Art books;
- Comics or graphic novel anthologies (although for 2021, I did include anthology projects that featured short stories with illustrations, which I’m pretty sure I didn’t do in 2020.);
- Incomplete funding campaigns;
- Campaigns that didn’t neatly fit into my target dates of analysis. (There were 8 or so that bridged the December/January divide. Perhaps I might do a sub-analysis of them another time.)
- Nonfiction reference books (including cookbooks);
- Single-author anthologies (i.e., anthologies where all stories were written by a single author).
Number Crunching!
Using the methodology above, I located 88 campaigns that met my criteria and reviewed each campaign to produce the following data.
Genres
This year, I thought I’d try to include the genre breakdown for anthology campaigns. I had to do some wiggling with the categories, as the data I collected was sometime much more granular than than was reasonable to include in a visual. Since there were no general fiction anthology campaigns that did not also feature a creative non-fiction component, I ended up lumping them beneath the Creative Non-Fiction genre in my analysis. Here’s a relatively granular graphic of anthology campaign genres, followed by a broader one:
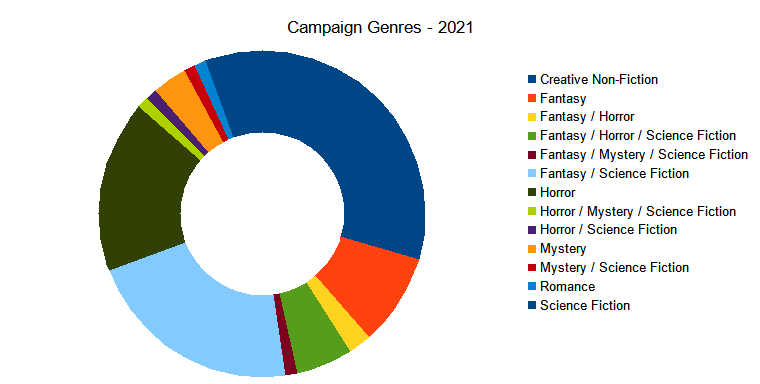
Breakdown of campaigns by genres (with percentages!):
- Creative Non-Fiction: 30%
- Fantasy & Science Fiction: 22%
- Horror: 17%
- Fantasy: 9%
- Fantasy, Horror, & Science Fiction: 6%
- Science Fiction: 6%
- Mystery: 3%
- Fantasy & Horror: 2%
- Fantasy, Mystery, & Science Fiction: 1%
- Horror, Mystery, & Science Fiction: 1%
- Horror & Science Fiction: 1%
- Mystery & Science Fiction: 1%
- Romance: 1%
That’s a lot of overlap across genres, right? Here’s a more simplified genre breakdown, this time focusing on how many anthology campaigns included each genre (i.e., counting counted campaigns multiple times if they had multiple genres… so F&SF would be counted twice, and H, M & SF would be counted three times because it is three different genres smashed into one campaign):
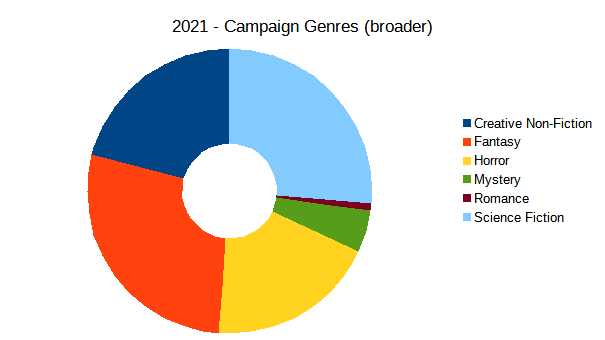
And in numbers:
- Fantasy: 28%
- Science Fiction: 26%
- Creative Non-Fiction: 21%
- Horror: 19%
- Mystery: 5%
- Romance: 1%
I was quite surprised that anthology campaigns in the Romance genre were such a small fraction of the total, given the overall popularity of the genre and its broad readership.
I think these genre breakdown statistics are quite illustrative because they show that the majority of multi-author Kickstarter anthology campaigns (79%, to be precise) fundraise for genre (F/SF/H/M/R) anthologies.
I think this breakdown is reflective of the status of the publishing industry, and I speculate that multi-author anthologies in the general fiction category are much more likely to be published traditionally, so there’s no real need (or demand) for them to be crowdfunded. Same thing goes for multi-author Romance anthologies—the Romance genre is so popular that I suspect there’s no real need to crowdfund Romance anthologies unless they’re a bit edgier than the average reader of Romance novels and anthologies would usually consume. Since Mystery is also a rather accessible genre for the average reader, I imagine the same logic applies there (unless you’re a huge fan of Sherlock… which I’ll address in another post soon).
For most editors in the speculative fiction publishing world, publishing short fiction in the Fantasy, Horror, and/or Science Fiction genres is a labor of love. It is not a profitable industry, as any editor of publications that publish short fiction in these genres will tell you. F/H/SF novels already don’t receive the same amount of marketing by publishers or shelf space in the average, traditional bookstore as the more commonly-accessible Fiction, Mystery, Romance, and Non-Fiction genres.
(Let’s be real: speculative fiction is less accessible to the general public because features a learning curve. There are a lot of people out there who don’t have the energy or brainpower for that outside of work and/or school and/or other daily responsibilities.)
It makes sense—to me at least—that the majority of Kickstarter anthology campaigns are lobbying to fund speculative fiction anthologies that would never be published otherwise. (Okay, the anthologies *could* be published otherwise, but the majority of these campaigns SPECIFICALLY are seeking to raise money so they can pay their writers—and in several cases, editors—for their labor and anthology contributions.)
Campaign Locations
The majority of 2021 Kickstarter campaigns were launched from the United States, so I thought I’d make some maps to show the 2021 distribution (and go back to the 2020 data so you could see what changed. The tool I used did not allow me to select Washington, DC as a state, so therefore 2 campaigns for 2021 and 1 campaign for 2020 that were DC-based are not represented on the maps below.
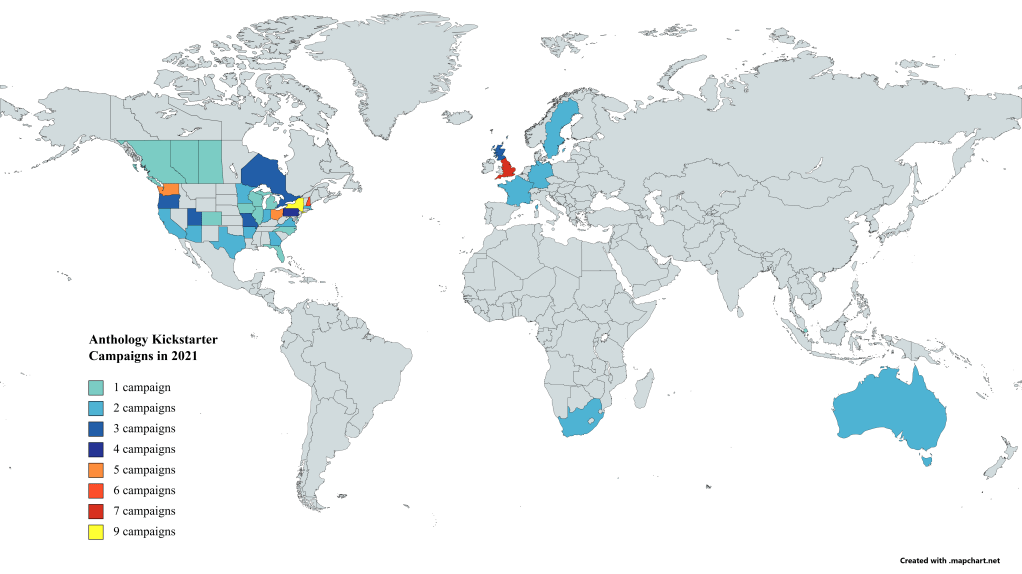
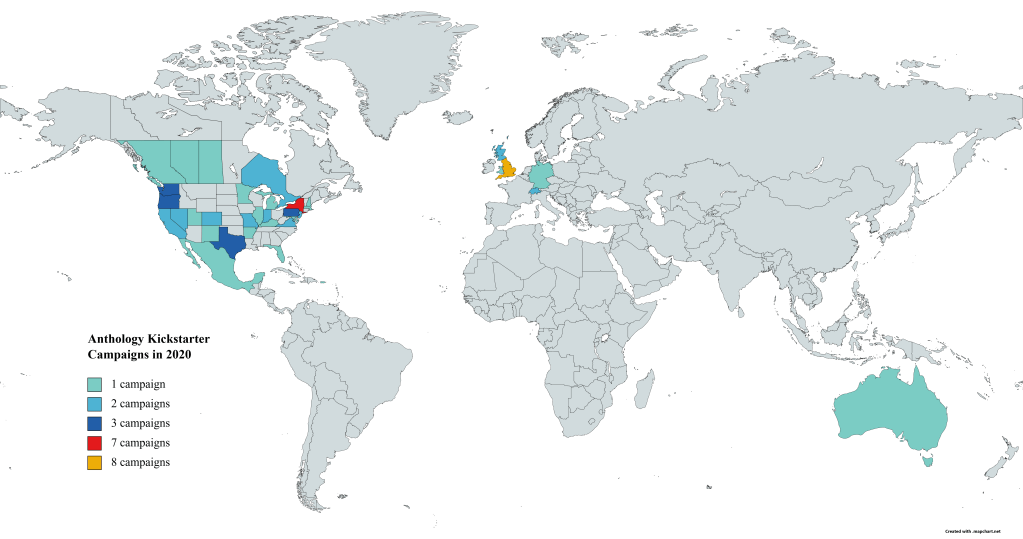
The maps show us few tidbits I thought interesting:
- There were more anthology campaigns in 2021 than in 2020.
- In 2020 and 2021, New York was the US state that launched the most anthology campaigns.
- In 2020 and 2021, The UK (England) was the non-US that launched the most anthology campaigns.
These maps confirm what I already suspected: Kickstarter is predominantly used by English-speaking countries for anthology fundraising. I also found it interesting that in 2020, there were no anthology campaigns launched in the Deep South. I would be curious to compare campaign launch cities with population density and reliable internet access to see to what extent those all correlate.
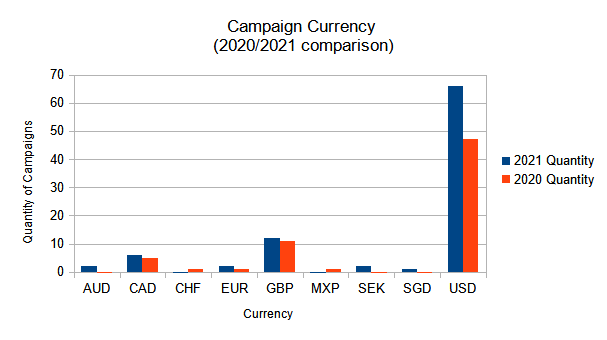
Currencies
Given the distribution of campaign locations, it shouldn’t be a surprise that in 2020 and 2021, the most common anthology campaign currencies were:
- USD
- GBP
- CAD
Goals and Funding
For the next few sections, I converted all non-USD amounts to USD on March 23, 2022 to make it easier to do number crunching across campaigns in different currencies.
With that out of the way, here are the 2021 financial goals and funding amounts for completed anthology campaigns on Kickstarter in USD!
- 2021 – Average Goal: $6,426.75
- 2021 – Lowest Goal: $150.00
- 2021 – Highest Goal: $50,000
But how much did successful anthology campaigns actually raise in 2021?
- Average amount raised: $10,872.92
- Lowest amount raised: $253.00
- Highest amount raised: $80,299.00
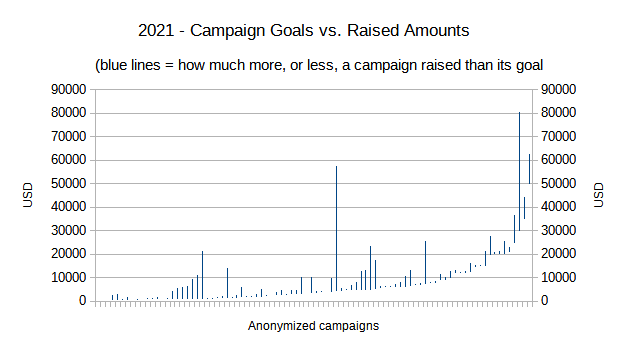
- Average percent of 2021 goal raised: 253.20%
- Lowest percent of 2021 goal raised (while still being a successful campaign): 100.10%
- Highest percent of 2021 goal raised: 2,138.70%
(In case you’re planning your own campaigns, it’s worth noting that 19.3% of anthology campaigns in 2021 were between 100% and 110% successful. Glancing at the data for these campaigns while I type, I *think* it was because they had very specific, niche themes that cater to very targeted, specific audiences but I’d need to go back and read the campaign pages more carefully to verify. My advice to anthology campaign planners: plan marketing strategies as if your campaign will fall in that ~20% (or worse), and promote aggressively while your campaign is live!)
And how do those 2021 goal and funding numbers compare to the ones from 2020?
- Average amount raised in 2021 was $4,154 more than in 2020. (+161.83%)
- Lowest amount raised in 2021 was $98 more than in 2020. (+163.23%)
- Highest amount raised in 2021 was $41,761 more than in 2020. (+208.36%)
- Average goal was $2,096.41 more ambitious in 2021 than in 2020. (+148.41%)
- Lowest goal was $87.41 more ambitious in 2021 than in 2020. (239.66%)
- Highest goal was $25,000.00 more ambitious in 2021 than in 2020. (+200%)
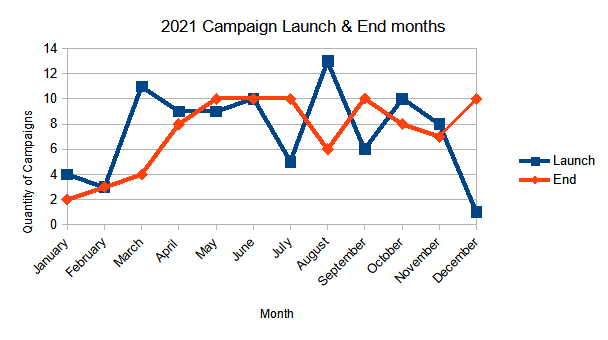
Launch Timing
In 2021, August was the most popular month to launch an anthology Kickstarter campaign, while… there was apparently no popular month to end one! May/June/July was the most popular… quarter(?) to end one.
Comparing the 2021 campaign start and end dates with those from 2020 initially looks like a hot mess, but…
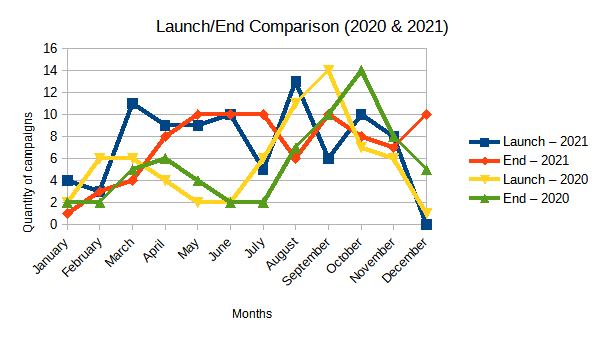
… assuming the 2021 data is representative of (or at least similar to) pre-COVID campaign data, overlaying 2020 data on the 2021 data is actually super fascinating.
Keeping in mind that the majority of multi-author anthology Kickstarter campaigns are launched in the United States, you can *see* in the 2020 data when campaign launchers 2020 realized that COVID was spreading across the country. Rather than campaign launches spiking in March 2020 (like they did in 2021, after the holiday season), they dipped and stayed down until COVID lockdowns in the US lifted.
In both 2020 and 2021, campaign launchers demonstrated sanity and almost universally noped out of trying to run a Kickstarter campaign over the winter break (and Christmas holiday) season. This decrease in new campaigns at the end of the year is consistent with the holiday slump I’ve noted in prior years.
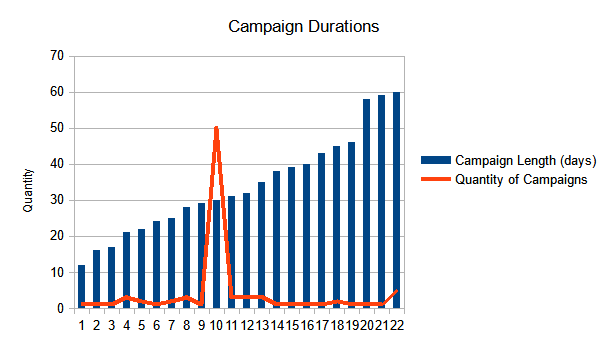
Campaign Durations
- Average campaign length: 32 days.
- Shortest campaign: 12 days.
- Longest campaign: 60 days
Here’s a visualization of the campaign durations for 2021 multi-author anthologies:
Backers
- 2021 – Average: 235
- 2021 – Fewest backers: 15
- 2021 – Most backers: 1,571
Project We Love Status
This is a pretty self-explanatory section. To how many multi-author anthology campaigns did Kickstarter give “Project We Love” status?
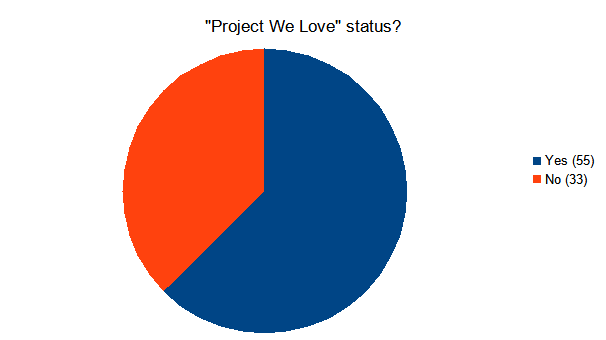
“Project We Love” status probably had more weight on campaign success than I originally considered in my 2020 analysis. It’s hard to assess to what extent this label affects a campaign, because my datasets for 2020 and 2021 only include campaigns that hit their funding goals.
To accurately assess impact of “Project We Love” designation on a campaign’s success, one probably needs to be checking Kicktraq stats on top of Kickstarter campaign data in order to see whether the date “Project We Love” status is given to a campaign creates a funding bump to carry the campaign toward its goal.
But, given that about 2/3 of anthology campaigns in 2021 with that status were successful, I’d say figuring out how to aggressively market your campaign and attract the “Project We Love” designator is probably a smart step toward success.
Conclusions
In 2021, campaign project leaders could expect their anthology campaigns to raise an average 253.20% of their campaign’s fundraising goals over about 32 days, thanks to an average of 235 backers.
Remember, in 2020 campaign project leaders could expect their anthology campaigns to raise an average 217.88% of their campaign’s fundraising goal over the course of about 31 days, and they could expect an average of 195 backers.
If your multi-author anthology campaign was successful in 2021, you probably launched it from the United States, and it probably fit into the genre(s) of science fiction, fantasy, or horror because these three genres accounted for 73% of such anthology campaigns.
Unlike in 2020, in 2021, getting your multi-author anthology campaign designated as a “Project We Love” by Kickstarter likely mattered to your campaign’s success.
Things I would have liked to research further:
- Genre distribution by campaign location. Did the UK have more horror anthologies than the US? Do certain places tend to launch more creative nonfiction campaigns?
- Did geographic location impact funding goals?
- What was the genre distribution for campaigns to which Kickstarter gave “Project We Love” status?
- How many campaigns funded open calls for submissions?
- How many campaigns published a full, locked-in table of contents when they launched?
- When do campaigns typically earn “Project We Love” status, and how does it affect their respective funding trajectories?
