Happy Kickstarter analysis day! This post contains my analysis of all the successful anthology Kickstarters that happened in 2022, and builds on some of the data gathering I talked about in my analyses of anthology campaigns in 2020 and 2021.
What’s in this post?
- My methodology
- Maps
- Charts
- Number crunching
- Thoughts
- Analysis
- Comparisons to 2020 and 2021 datasets
- Conclusions
- Additional research questions
Methodology
Remember, I gather ALL this data by hand and put it into a spreadsheet. I am human (with health problems from time to time), and there may be errors in my source data. For these analyses, I refer back to notes from past years and try to replicate the data-gathering process the same way to ensure consistency across my analyses.
Finding the data: I visited Kickstarter.com’s “Show Me” feature and viewed all results for “anthologies” projects in PUBLISHING on EARTH sorted by END DATE. (My 2020 analysis taught me that using “anthologies” as my search term encompasses the same results as “anthology”, and yields additional campaigns that “anthology” searches do not.) [NOTE: Kickstarter now makes it a little harder to find this information—you have to scroll past not only all live campaigns, but also all future campaigns, too, before you can see all the completed campaigns sorted by end date.]
I only considered anthology projects that launched on January 1, 2022 and ended by (or on) January 1, 2023. This is consistent with the methodology for my 2020 and 2021 analyses. I would have liked to also include the bridge-year campaigns (i.e., campaigns that started in 2021 and ended in 2022, or started in 2022 and ended in 2023), but that would muddy up the data too much and make it harder for me to remain consistent with next year’s analysis.
As with my 2021 dataset, I relied on the start/end dates and campaign duration numbers that Kickstarter posts at the bottom of each completed campaign (instead of manually calculating these dates myself.)
NOTE: I probably missed about 5 campaigns this year, because at one point during my data gathering, I accidentally misread my notes and did not include a few campaigns that included stories AND poetry. This means my overall total for campaigns for 2022 is a little lower than it should be. I (personally) don’t think that significantly impacts the stories my data tells, and I wanted to publish this analysis before March, so I opted not to re-do my search, but if you’re duplicating my efforts I *strongly* recommend you include those anthologies, too.
What doesn’t this analysis include?
For my Kickstarter analyses, I define “anthology” as a collection of short stories by multiple authors; this means that collections of multiple stories by the same author are not included in my data sets.
Kickstarter still does not make it easy to track projects that lauch but do not successfully reach their funding goals, and I doubt this will change. (Kickstarter backers only want to see success, which unfortunately means Kickstarter campaign creators will probably remain in the dark forever about how many anthology campaigns fail each year.) Unfortunately, this means I will probably never get to add that data to my annual analyses, because I highly doubt I will ever have the time to check Kickstarter campaign launches and failures every day.
This analysis does NOT include:
- Art books.
- Comics or graphic novel anthologies. [NOTE: I did include anthology campaigns with illustrated short stories, as I did in 2021.]
- Incomplete funding campaigns.
- Magazine funding campaigns.
- Nonfiction reference books.
- Photo essay books.
- Poetry collections.
- Single-author anthologies.
Number Crunching!
Using the methodology above, I located 59 campaigns that met my criteria (down from 88 in 2021 and 67 in 2020), and reviewed each campaign to produce the following data.
Genres
Genres are very sticky beasts, and they do not like being trapped in a container. In my analysis post for 2021 Kickstarter anthology campaigns, I introduced genre breakdowns, so I’ve tried to mimic the same methodology here for 2022 (apologies in advance – the colors aren’t exactly the same as last year, maybe I’ll get better data visualization software for next year!).
Here’s the granular breakdown of anthology campaign genres in 2022. It doesn’t tell you much, but it is pretty:

Breakdown of campaigns by genres from the wheel above (with percentages!):
- Creative Nonfiction = 8%
- Creative Nonfiction + Fantasy + Science Fiction = 2%
- Creative Nonfiction + Fiction = 2%
- Creative Nonfiction + Horror = 2%
- Creative Nonfiction + Mystery = 2%
- Erotica + Fantasy + Horror = 2%
- Fantasy = 5%
- Fantasy + Horror = 8%
- Fantasy + Horror + Science Fiction = 12%
- Fantasy + Mystery + Science Fiction = 2%
- Fantasy + Science Fiction = 24%
- Fiction + Humor + Science Fiction = 2%
- General = 2%
- Horror = 7%
- Horror + Mystery + Science Fiction = 3%
- Horror + Romance = 2%
- Horror + Science Fiction = 2%
- Mystery = 7%
- Science Fiction = 8%
(Note that I incorporated the genre “weird” into Science Fiction + Horror, and “superheroes” into Fantasy + Science Fiction”.)
I think this level of granularity would not be particularly helpful to folks planning Kickstarter campaigns (though I could be wrong!), so like last year, I’ve simplified it into a more concise pie chart. The pie chart below focuses on how many anthology campaigns included each genre (i.e., counted campaigns multiple times if they had multiple genres, so Fantasy + Horror + Science Fiction would be counted three times, once for each genre):

And the accompanying percentages for those categories in the pie chart above:
- Creative Nonfiction = 8% (DOWN from 21% last year, but that’s probably because I decided not to roll as many campaigns in to this category and included an “Other” category this year)
- Fantasy = 30% (UP from 28% last year)
- Horror = 21% (UP from 19% last year)
- Mystery = 7% (UP from 5% last year)
- Other = 2% (New category)
- Romance (includes Erotica) = 2% (UP from 1% last year)
- Science Fiction = 30% (UP from 28% last year).
These percentages show us that the majority of multi-author Kickstarter campaigns in 2022 fundraised for genre anthologies (90% of them, versus 79% in 2021!).
I’d be curious to know how many non-speculative multi-author campaigns failed in 2022 versus 2021, because CNF was overall a much smaller portion of successful campaigns in 2022, and I wonder how much of that was creators deciding to seek other funding routes outside Kickstarter.
I stand by my 2021 hypothesis that this breakdown probably reflects how General Fiction, Creative Nonfiction, and Romance projects are more likely to get picked up by traditional publishers and find broader readership, so there’s less need and demand for them to be crowdfunded compared to more niche Science Fiction, Fantasy, or Horror publishing projects. The same likely applies to the Mystery genre.
Campaign Locations
As in previous years, the majority of campaigns were launched in the United States. Here’s the location distribution for multi-author Kickstarter campaigns in 2022:

In 2022, New York was once again the US state that launched the most multi-author anthology Kickstarter campaigns, and the UK (England) was once more the non-US country that launched the most of these campaigns.
For comparison, here’s the location distribution for 2021:

In 2022, there were very few multi-author anthology campaigns launched outside of English-speaking countries, representing a decline from my 2021 data (but still consistent with my analysis that Kickstarter is almost-exclusively used by English-language anthology projects). This surprised me, because I expected to see the upward trend from 2020 to 2021 continue into 2022. I’ll posit that rising production costs, shipping delays, geopolitical factors, and the ridiculous cost of mailing books overseas (and even from the US to Canada, or vice versa) probably were influencing factors.
Currencies
Here’s a breakdown of how many campaigns used which currencies:

Goals and Funding
For the next few sections, I converted all non-USD amounts to USD on February 9, 2023 so that it would be easier for me to crunch numbers comparatively across all multi-author anthology Kickstarter campaigns.
Funding goals for multi-author Kickstarter campaigns in 2022:
- 2022 – Average Goal: $4,272.69 (DOWN by 33.5% (-$2,154.06) from $6,426.75 in 2021!)
- 2022 – Lowest Goal: $250 (UP by 40% (+$100) from $150 in 2021!)
- 2022 – Highest Goal: $30,000 (DOWN by 40% (-$20,000) from $50,000 in 2021!)
But how much did successful campaigns raise in 2022?
- 2022 – Average amount raised: $7,715.71 (DOWN by 29% (-$3,157.21) from $10,872.92 in 2021!)
- 2022 – Lowest amount raised: $674 (UP by 62.3% (+$421) from $253 in 2021!)
- 2022 – Highest amount raised: $32,191 (DOWN by 60% (-$48,108) from $80,299 in 2021!)
Here’s the percentages for how much successful campaigns exceeded their goals:
- 2022 – Average percent of 2022 goal raised: 331.98% (UP from 253.2% in 2021)
- 2022 – Lowest percent of 2022 goal raised while still being successful: 100.71% (SAME marginally as 100.1% in 2021)
- 2022 – Highest percent of 2022 goal raised: 1,735.8% (DOWN from 2,138.7% in 2021)
Launch Timing
In 2022, September was the most popular month to launch a multi-author anthology Kickstarter campaign, while October was (naturally) the most popular month to end one.

For comparison, here’s what the launch end/months looked like in 2021:
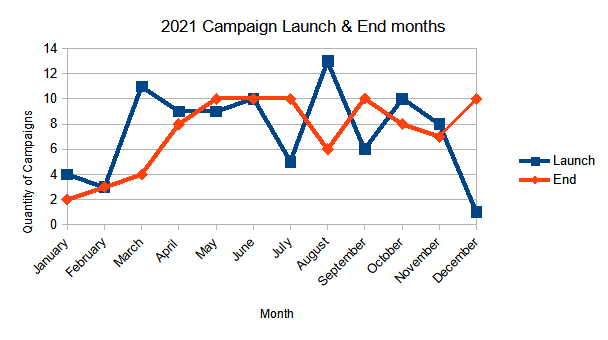
As in previous years, campaign launchers in 2022 avoided the guaranteed stress-overload of trying to run a Kickstarter campaign over the winter break and holiday season. This decrease in the amount of new campaign launches at the end of the year is consistent with the holiday slump I observed in 2020 and 2021.
Campaign Durations
- 2022 – Average campaign length: 31 days
- 2022 – Shortest campaign length: 14 days
- 2022 – Longest campaign length: 60 days
Backers
- 2022 – Average number of backers: 199 (DOWN 15.3% from 235 backers in 2021)
- 2022 – Fewest backers: 10 (DOWN 33.3% from 15 backers in 2021)
- 2022 – Most backers: 754 (DOWN 52% from 1,571 backers in 2021)
Campaign Tiers
This is a new section for 2022! I did collect these numbers for prior years, so if you’d like to see them, please tell me!
In 2022, these were the average prices of book reward tiers in multi-author anthology campaign tiers. Not all campaigns offered all formats in their book tiers, but most offered paperback and e-book versions. Interestingly, Creative Nonfiction campaigns seemed to REALLY expect their backers to be willing to shell out money for any formats of the finished multi-author anthology.
(NOTE: These are *not* adjusted by currency, partially because I’m feeling lazy, partially because these numbers seemed to stay consistent even when currencies changed. If you want specific pricing data for specific currencies, please reach out and I’d be happy to give you that data!)
E-book:
- Average price: $10.69
- Lowest price: $3 (<– in USD)
- Highest: $50 (<– in GBP; the highest USD price was $25)
Paperback book:
- Average price: $29.74
- Lowest price: $12 (<– in GBP; the lowest USD price was $13)
- Highest: $200 (<– in DKK; the highest USD price was $150)
Hardback Book:
- Average price: $49.62
- Lowest price: $25 (<– in GBP; the lowest USD price was $30)
- Highest: $125 (<– in AUS; the highest USD price was $120)
Project We Love Status
How many successful multi-author anthology campaigns earned Kickstarter’s coveted “Project We Love” status in 2022?

Surprisingly, this pie chart looked almost exactly like the pie chart for 2021:
Given that about 2/3 of anthology campaigns in 2022 and 2021 with “Project We Love” status were successful, I’d say that it certainly can’t hurt to earn it!
(Reminder: To accurately assess impact of “Project We Love” status on a campaign’s success, one probably needs to be checking Kicktraq stats AND of Kickstarter campaign data while it’s still live to see whether the date “Project We Love” status is granted creates a big enough funding bump to carry a campaign to victory.)
Conclusions
In 2022, successful project leaders could expect to spend 31 days on their multi-author anthology campaigns to raise about 332% of their campaign’s funding goal, thanks to an average of 199 backers.
If your multi-author anthology campaign was successful in 2022, you probably launched it from the United States in September, and it probably featured science fiction, fantasy, and/or horror genres.
Receiving Kickstarter’s “Project We Love” status very likely was a factor in your campaign’s visibility and overall success.
In 2022, 11.9% of multi-author anthology campaigns were between 100% and 110% successful, down from 19.3% of campaigns in 2021. If you’re planning on trying to just barely squeak by over your goal amount, the odds are NOT your favor. Again, I can’t tell you how many multi-author anthology campaigns failed in 2022 because Kickstarter doesn’t like sharing that data, but what I CAN tell you is that you’re probably going to need to lower your target goal amounts AND put more energy into marketing if you want your campaigns in 2023 to succeed.
I interpret this 11.9% to mean that in 2022, more campaign teams were cautious with their campaign goals (i.e., they lowered their expectations of how much money they could hope to raise). Alternatively, more campaigns may have been able to successfully market and attract funding, but when we consider the lower overall quantity of successful multi-author anthology Kickstarter campaigns in light of the significant decreases in average + highest amounts for campaign goals and amounts raised, it seems (to me) that there was overall significantly less interest from creators in launching and from consumers in paying for these campaigns.
It’s also worth noting that these declines could actually reflect supply/demand for Kickstarter anthology campaigns settling back into a pre-pandemic norm. I only started gathering these data in 2020, so I have no idea what the pre-2020 stats look like. We DID see:
- The average amount raised go UP by 161.83% from 2020 to 2021, and then DOWN by 29% from 2021 to 2022.
- The average goal went UP by 148.41% from 2020 to 2021, and then DOWN by 33.5% from 2021 to 2022.
- Average number of backers went UP from 195 backers in 2020 to 235 backers in 2021, then DOWN to 199 backers in 2022.
- Most backers number went UP from 897 backers in 2020 to 1,571 backers in 2021, then DOWN to 754 backers in 2022.
We won’t know until later whether 2022 was typical for Kickstarter multi-author anthology campaigns, but for the sake of authors and publishers, I hope this downward trend was a one-year fluke, not part of a broader downward trend.
(EDITED TO ADD:
To answer a question I’ve already received:
All successful campaigns had a physical fulfillment tier; no campaign relied solely on digital rewards. This means that neither the overall lowering of campaign goal amounts nor the decline in overall funding raised can be attributed to publishers trying to cut costs by going digital-only.)
Things I would have liked to research further:
- Did home locations for campaigns (i.e., states where they were launched) have any correlation with how much funding a campaign sought?
- What genres most frequently earned “Project We Love” status?
- How many campaigns were used to fund open calls for submission?

2 thoughts on “Kickstarter Anthologies in 2022”